Overview: An example study of Industrial Process variability by Weibull Analysis is provided. In particular, bolt strength variability is evaluated, based on data from NASA report NASA/TM-2012-217454. Brief comments are provided regarding use of Weibull vs. Gaussian Analysis for such applications.
Discussion: Gaussian Analysis is often used to analyze a wide variety of industrial phenomena. Many readers may want to see how Weibull Analysis can be used in lieu of the Gaussian, along with a brief discussion of how these two methods compare.
The Data: Six "identical" bolt specimens were subjected to pure tensile loading to determine failure load. While additional samples were subjected to various loadings, only tensile specimens were evaluated in this example. The original data is available by Internet search (1).
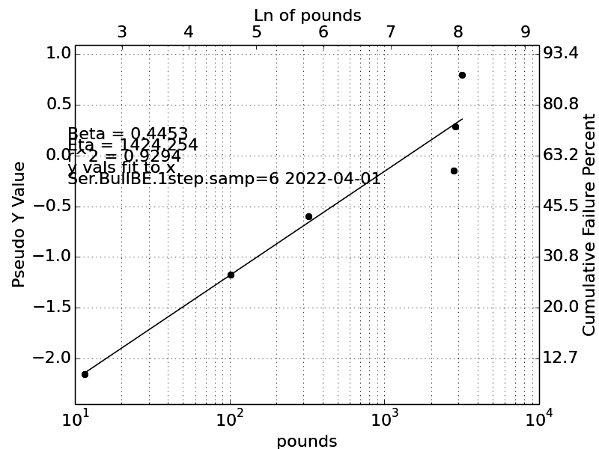
Weibull Plots: While the plot is not presented here-in, a 2 parameter Weibull Plot was performed. There were 3 evidences of poor correlation:
Taken together, this information suggests a 2 parameter Weibull cannot adequately describe the data. A large β often indicates a need for 3 parameter Weibull Analysis which produced the following result:

Discussion: The Weibull Plot above was created by the Watson-Weibull program, using data inputs from the referenced test report. Results were confirmed by spreadsheet. The above graph is a 3 parameter Weibull Plot, which assumed Xo=17354. The Weibull Plot confirmed accuracy of 3 parameter Weibull.
There is sufficient evidence to believe a 3 parameter Weibull Analysis adequately describes the bolt population tension failure distribution. We observe:
Discussion: Weibull vs. Gaussian Analysis: Weibull Analysis is capable of modeling a data-set which is exactly Gaussian (but not vice versa). When Weibull is applied to such data-sets, it will indicate a β of approximately 3. Weibull β at .48 indicates the failure data set is not Gaussian, and insistent use of Gaussian models will likely produce poor results.
If Gaussian Analysis is attempted, it should be followed by some form of Gaussian verification test (e.g. Filleben) which will likely confirm inadequacy of Gaussian Statistics to adequately describe bolt tension failures.
Conclusion: An example of using Weibull to analyze industrial product variation has been presented. Traditional use of Gaussian Analysis has several disadvantages, including predicted population values extending far beyond realistic performance ranges. When a population truly is Gaussian, Weibull Analysis can be effectively applied, and will produce usable results. The Weibull β parameter for true Gaussian populations will be about 3 for such circumstances
The study above is fairly convincing; however, data-sets of 6 points are likely to produce erratic results regardless of the statistical method used (Gaussian, Weibull, Log Normal or anything else.) Because laboratories are cost conscious, such small data-sets are often used; but, whenever possible data-set size should be larger.
When no basis exists for knowing the test data distribution, the example above suggests Weibull should be used as a first attempt at analyzing data, because the determined β often indicates which follow-on analysis is most promising. A "gut impulse" to initially use Gaussian squanders this opportunity.
Footnotes:
1. Test data was extracted from NASA, "Aerospace
Threaded Fastener Strength in Combined Shear and Tension Loading, by B.E.
Steeve and R.J. Wingate, Marshall Space Flight Center, Huntsville,
Alabama, Report NASA/TM-2012-217454 dated March 2012. The NASA document
provides neither copyright notices nor Public Domain notices. While raw
data is arguably Public Domain, it has not been reproduced out of respect
for the authors.
2. All 6 samples were failed in tension; but, three of them failed in the
thread area. Many engineers argue that this represents a different mode of failure
and should be analyzed as a separate data-set. This notion would reduce the
data-set to a mere three points and three data-points is simply not
enough to produce credible results. These kinds of considerations cause analysts
to struggle over data-sets, to analyze them in various ways and to examine
Weibull plots for evidence that a particular analysis is convincing.
Copyright 2022 by Paul F. Watson
All Rights Reserved
Updated 1 April 2022