
Introduction: Weibull Analysis is a particular type of statistical analysis; thus we need clear concept of statistical analysis before “describing Weibull's unique abilities”.
Statistical Analysis describes the likelihood of various outcomes resulting from some kind of repeated random event. Because the event is random, there is no way of anticipating the result of a particular “trial event”, but statistical methods can determine likely overall results. Often, it is the “overall result” that matters rather than the minutia.
Example 1: Japanese Admiral Togo’s fleet fought the Russian fleet on 10 August 1904. When Russians fired a salvo of 4 cannon shells, it made no difference whether the 1st or the 2nd shell hit his ship, but Togo did want to know the probability of getting hit once vs. twice. Probability of overall result was what mattered and this is what statistical predictions describe.
Example 2: If we flip a coin 13 times, we have no way of anticipating the result of the 5th (or any other) trial; but somehow, statistics can tell you the likelihood of “2 heads” after then entire experiment is finished. Likewise, it can tell you the likelihood of “3 heads”. Once again, statistics predicts likelihood of various final outcomes.
In general, statistical analysis (including Weibull) is important because probable final outcomes are important to scientists & others. Statistics can describe phenomena ranging from earthquake severity to number of annual flu infections.
How is Statistical Analysis Performed? When a scientist or a medical researcher collects data that appears to be random, he/she often wants to know if there is some pattern that can predict the likelihood of one final result vs. another. This is what statistics does! Statistics includes many different “distributions” and each one is a pattern that may (or may not) describe a particular data set. Typically, the statistical analyst makes a guess at the most likely pattern to fit the data. He/she tries one after another until a pattern/distribution is found that really describes the data set being studied. A few of these “distribution” patterns are:
* The Gauss (Bell Curve) distribution
* The Weibull distribution
* The Black Body radiation distribution
* The Binomial distribution
* The LogNormal distribution
Each of these has an underlying equation that can be graphed to show its typical shape. The chosen shape may (or may not) match a particular data set. The job of a statistical analyst is thus similar to a shoe salesman who tries on various sizes until he finds one that actually fits the customer. Now we come to the central question. What's unique and good about Weibull?
What is the Weibull ? The foundation of every distribution pattern listed above is an equation. If we graph that equation (just as we did in Algebra) we can see its shape. For the Weibull distribution, the defining PDF equation is complicated:

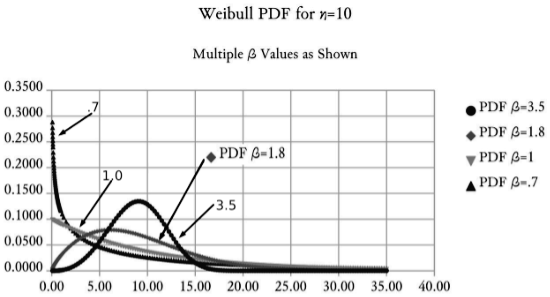
We can see the shape of the Weibull equation after graphing it (using β = various values) with the following result:

The four curves shown above result from using four different values for β (i.e. .7, 1, 1.8 and 3.5). In reality, β could be any number & thus there are hundreds of Weibull shapes that gradually evolve one plotted curve into the next. All of this seems rather tedious, but the main points are:
What is Weibull Analysis? The equation and graph above look rather fancy, but how can we use them to solve real world problems? Weibull Analysis is a group of mathematical and graphical methods that enable us to:
While
these goals may seem impossible, they can easily be achieved. The
methods are explained by introductory Weibull Analysis books.
Why
is Weibull Analysis Important? Weibull Analysis is important
because the widely used Gauss Bell Curve often fails to describe real
world data. A powerful statistical alternative is needed that has enough
shape flexibility to describe a wide variety of data. Consider the
following:
The Gauss Bell Curve is widely used to describe various phenomena. Often, it does a poor job because its shape is wrong:
The “likelihood patterns” for many of the world’s phenomena do not match the “basic shape” of the Gauss Bell Curve, and some other distribution MUST be used. Weibull is recommended because it is capable of describing a wide variety of data. In addition, well defined Weibull methods ensure that the analyst knows exactly how to approach most problems.
Conclusions:
Weibull Study Books: Internet search identifies books that teach the basics of Weibull Analysis. These usually offer one of two perspectives:
Methods Only: Weibull Analysis truly makes sense, but like all statistics, the learner may struggle to understand underlying concepts. The learner exposed to a “methods only” book may never figure out underlying ideas. Such analysts are likely to perform incorrect analyses.
Underlying Concepts + Analysis Methods: A thorough understanding of “basic concepts” provides the analyst with the tools to understand what data is saying, and how it should be analyzed. These assets enable him/her to solve unique problems.
Recommended Introductory Books: Two books stand out as possible introductory textbooks for the Weibull learner.
Copyright 2022 by Paul F. Watson. All rights reserved.